
We Tracked a Year of Quarterly Desk Rate Data: Here's Where AUD Desk Rates Actually Moved
We tracked a year of quarterly desk rate data across Australia. Here's where prices actually rose, fell, or held flat — and what it means for budgets.

Most "coworking is getting more expensive" headlines rely on a single snapshot — one quarter, one city, one number. We wanted to know what actually happened over a full year, city by city, using consistent quarterly data rather than cherry-picked comparisons.
So we tracked desk rates across Australia's flexible office market from Q2 2024 through to Q1 2026, using consistent quarterly market data. The results aren't quite what the standard "coworking costs are skyrocketing" narrative suggests — some cities barely moved, one city quietly outpaced the rest, and the national figure conceals more than it reveals.
The Headline Number Is Almost Meaningless on Its Own
Start with the national median desk rate, and the story looks flat. In Q2 2024, the national median sat at $665 per desk per month, down 3.3% on the previous quarter. By Q1 2025, it had recovered slightly to $660. By Q3 2025, it had climbed modestly to $667. That's a national movement of roughly two dollars across five quarters — statistically almost nothing.If you stopped there, you'd conclude Australian flexible office pricing has been essentially stable for two years. That conclusion would be wrong, because the national median smooths over wildly different stories happening in individual cities.
Sydney CBD Quietly Climbed All Year, While the National Number Stayed Flat
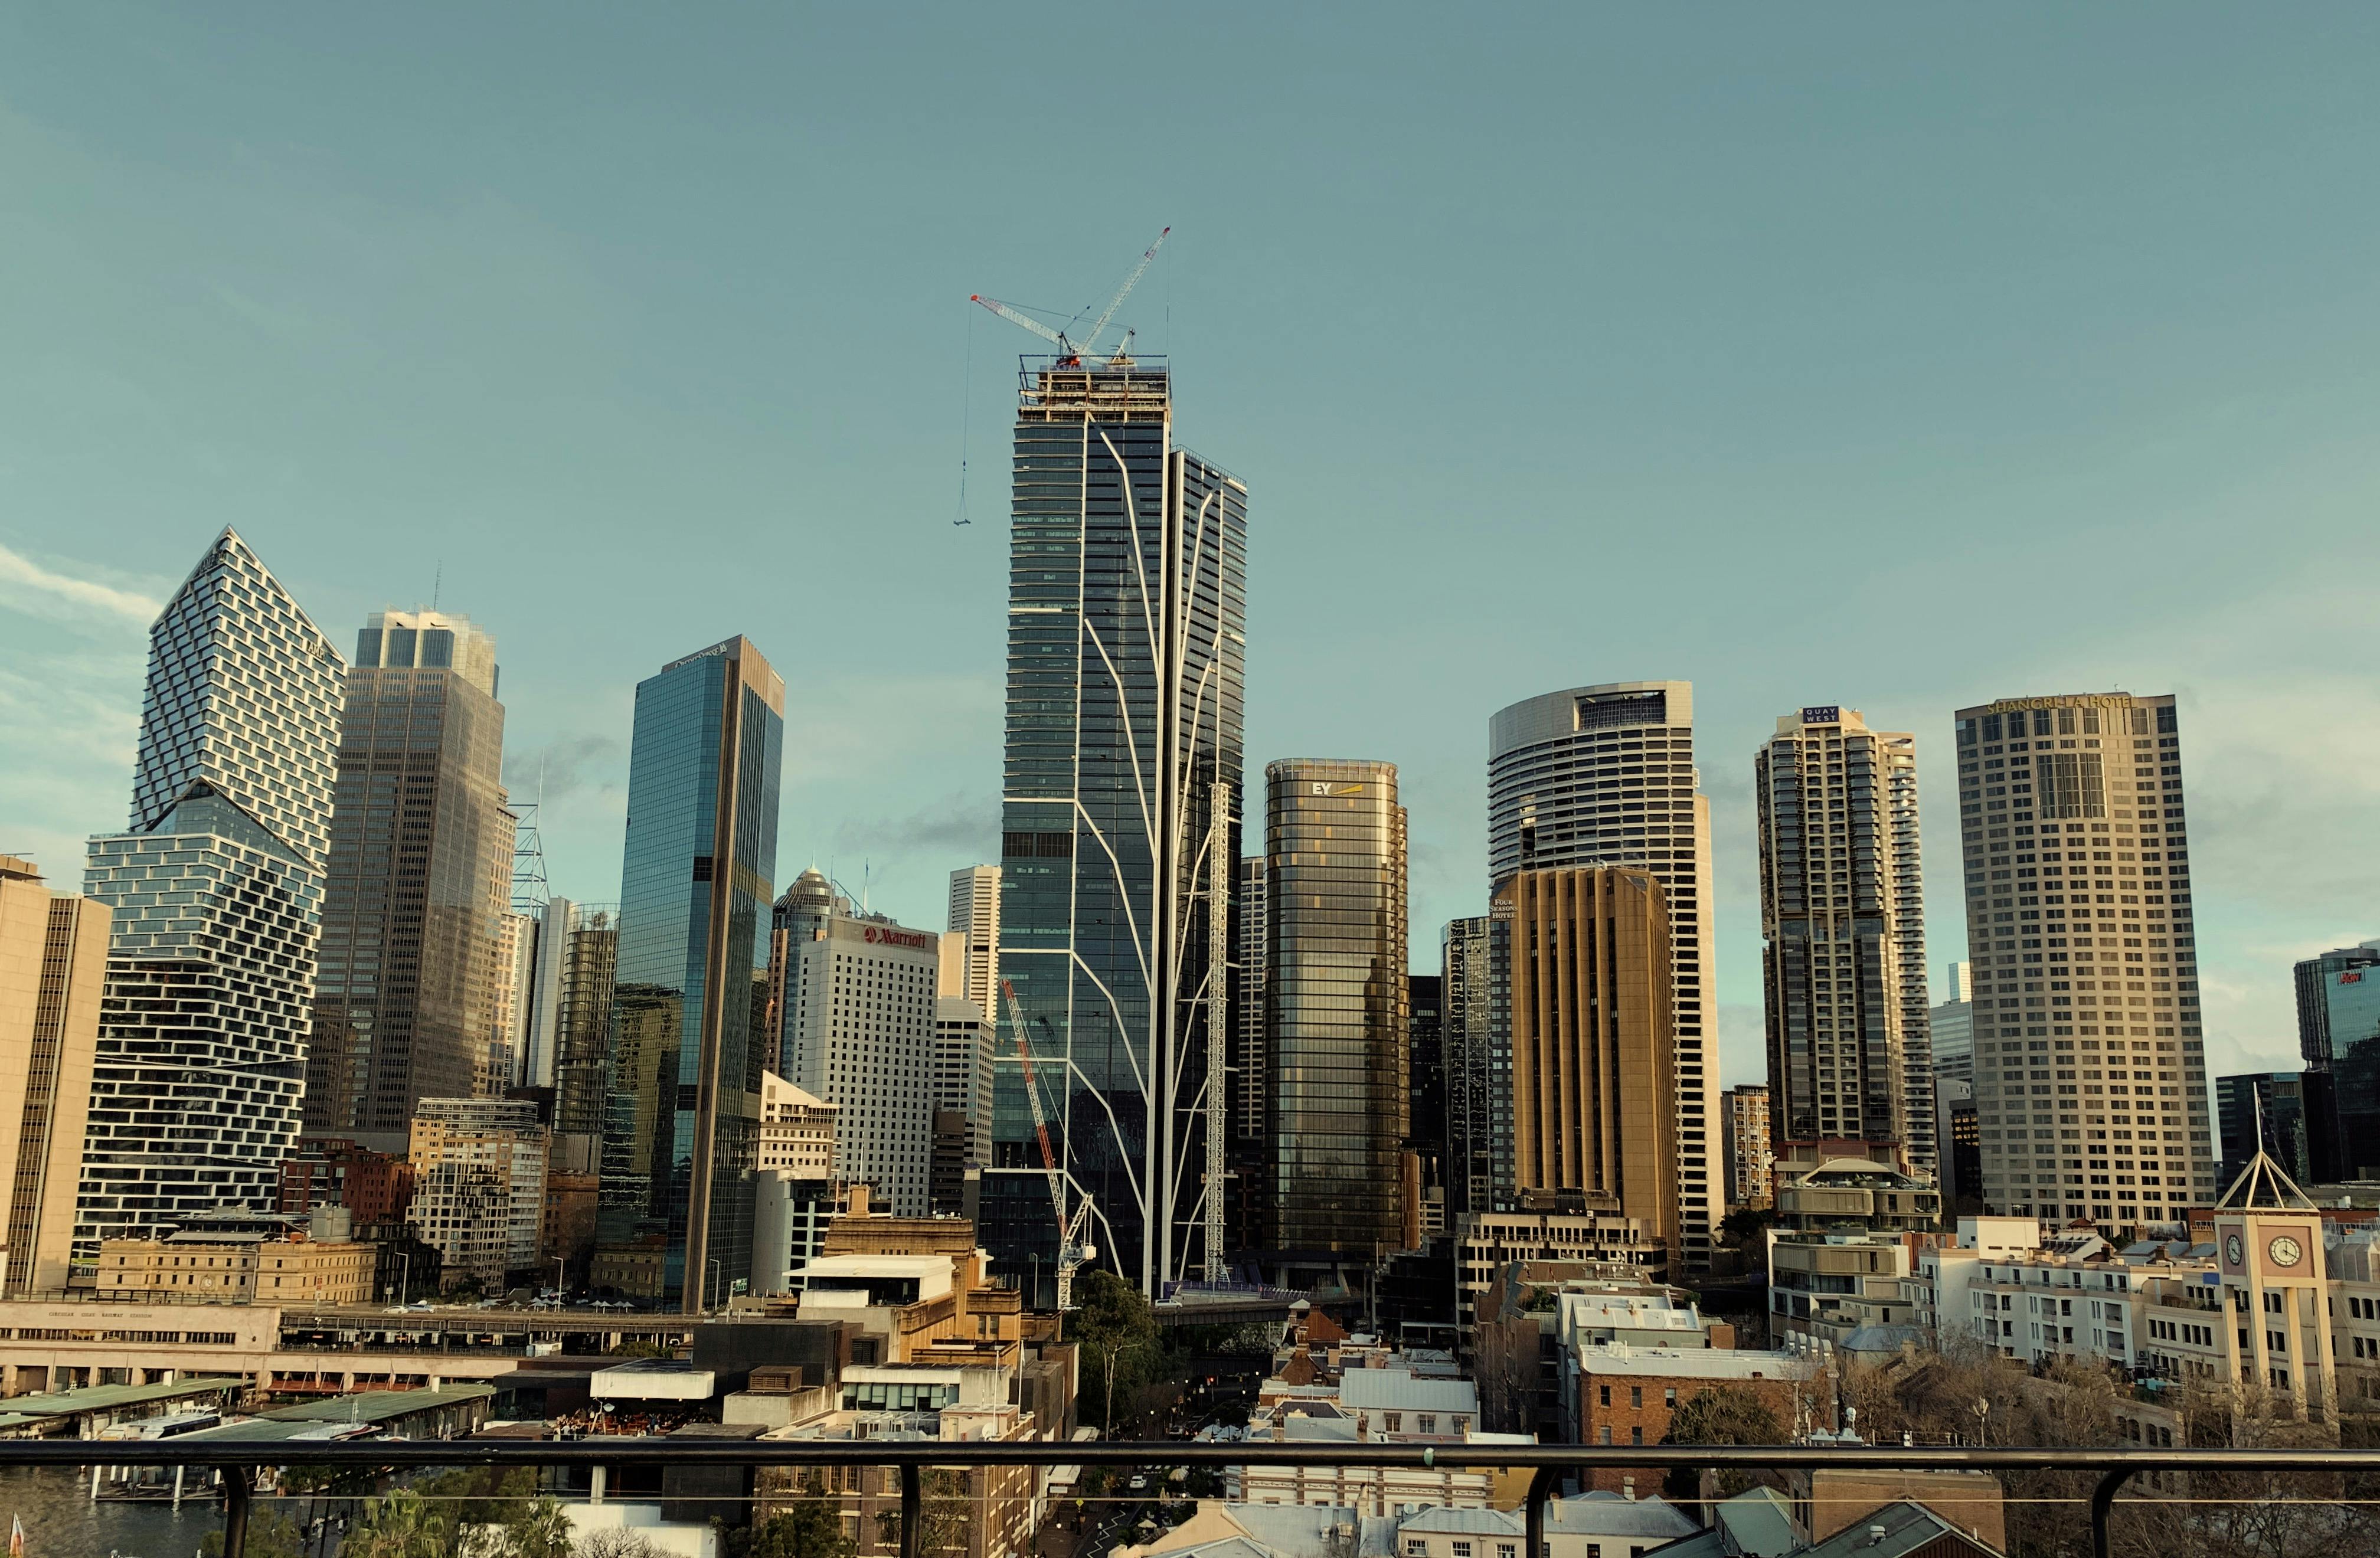
This is the finding that surprised us most. While the national median barely shifted, Sydney CBD desk rates moved consistently upward across the same period:
| Quarter | Sydney CBD median desk rate |
|---|---|
| Q2 2024 | $938 per desk |
| Q1 2025 | $1,000 per desk |
| Q3 2025 | $1,000 per desk |
| Q1 2026 | $1,024 per desk |
North Sydney Tells the Opposite Story
While Sydney CBD climbed steadily, North Sydney moved in the other direction over the same window. In Q1 2025, North Sydney desk rates eased back 4% to $522 per desk — a genuine softening at exactly the same time the CBD across the bridge was holding firm at $1,000.By early 2026, North Sydney listings were showing desk rates in a considerably wider range, from the low $500s through to the high $700s depending on building tier, suggesting the market has since segmented into clearer premium and value tiers rather than moving uniformly in either direction.
The practical implication: the gap between Sydney CBD and North Sydney pricing didn't just stay wide over this period — for a stretch in early 2025, it was actively widening, making North Sydney's relative value proposition stronger than it had been twelve months earlier.
Canberra Was the Most Volatile Smaller Market
Canberra's desk rates told a genuinely bumpy story across the tracked period. After rising through 2024, rates fell 7.4% in a single quarter to $500 per desk, then sat flat for the following quarter at the same $500 level, with available office space contracting 7% in the same window.This pattern — a sharp correction followed by an extended flat period — is distinct from the more gradual movements seen in Sydney and Melbourne, and likely reflects Canberra's smaller, more government-driven tenant base reacting in a less continuous way to demand shifts than the larger, more liquid east coast markets.
Melbourne Has Been the Most Genuinely Stable Major Market
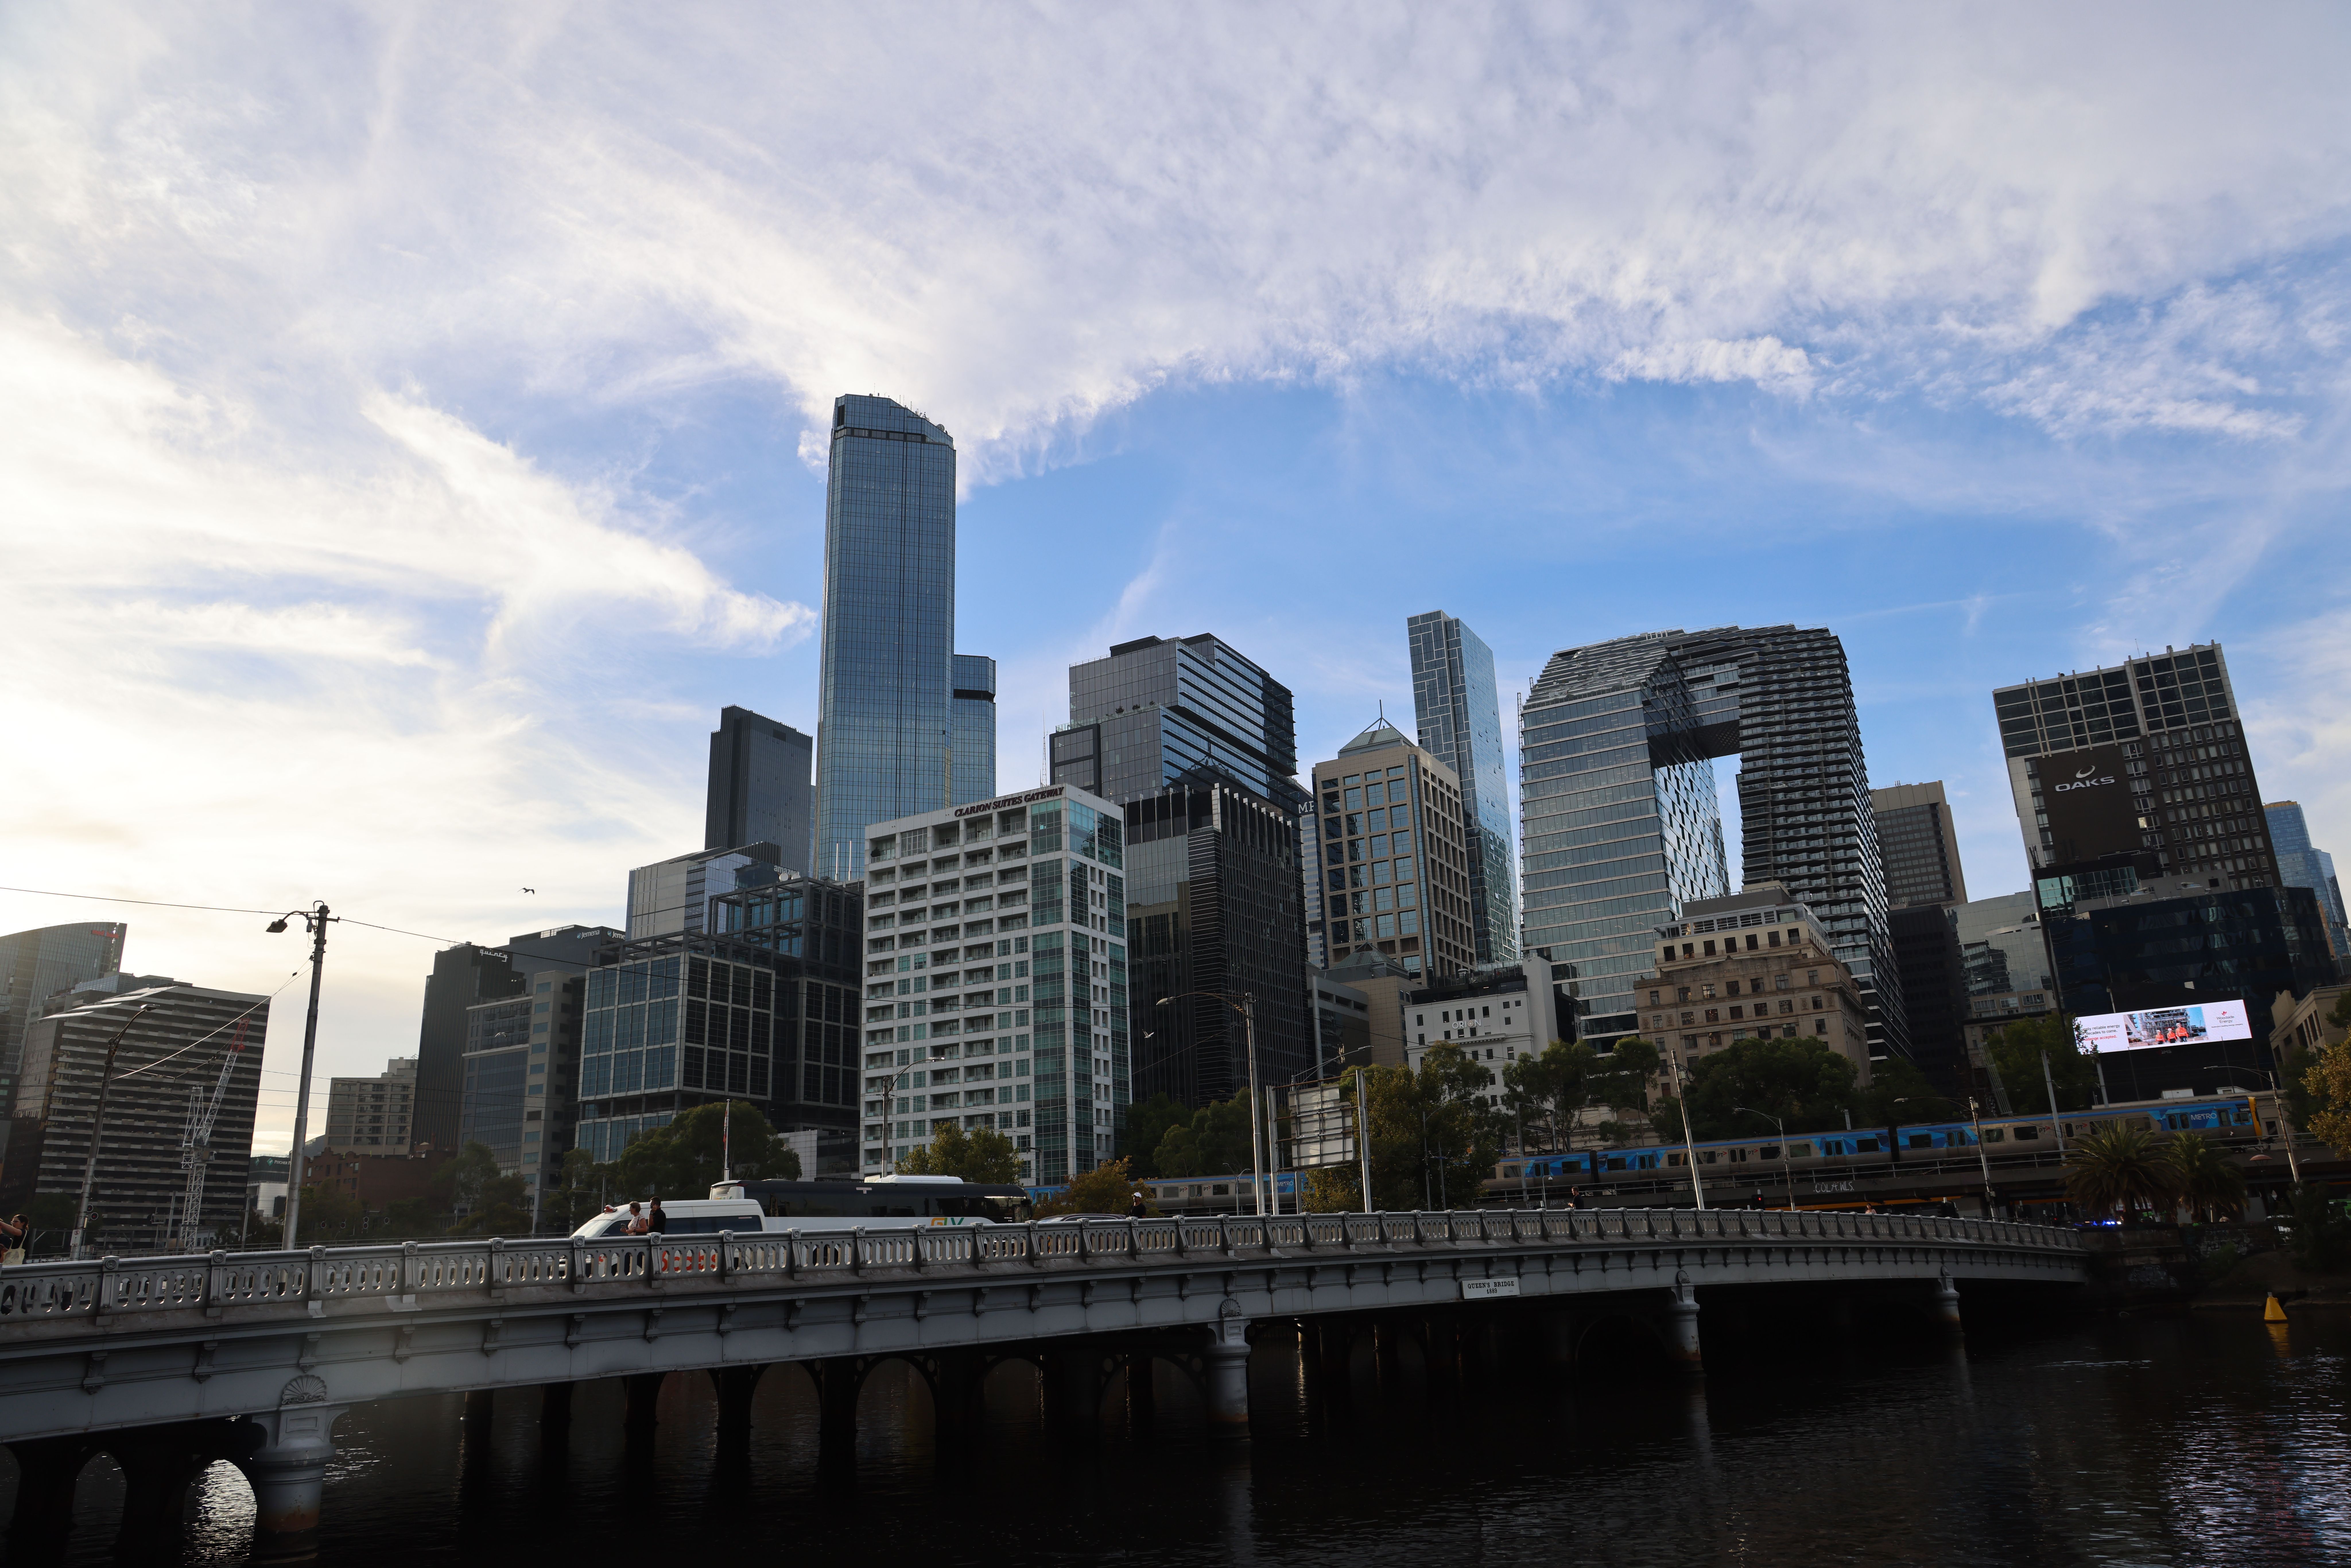
Of the major cities tracked, Melbourne showed the most consistent behaviour across the full period. Melbourne CBD desk rates moved from roughly $745 in mid-2024 to $704 in early 2025, settling around $725 by Q3 2025 — a tighter overall band than either Sydney or Canberra experienced, with smaller quarter-to-quarter swings throughout.This relative stability lines up with Melbourne's well-documented position as Australia's most price-competitive major flexible office market, consistently offering meaningfully lower rates than Sydney without the sharper volatility seen in Canberra's smaller market.
The "Flight to Quality" Pattern Shows Up Clearly in the Data
One trend holds consistently across almost every quarter we tracked: a persistent shift toward higher-quality space, even when overall pricing was flat or falling.By Q3 2025, available space for 50-plus person enterprise suites had contracted 6.5% nationally, while desk rates for that same segment jumped 8.7% to $750 — operators were deliberately reducing large-suite inventory and converting it into smaller, higher-margin team spaces, with 1–4 person offices growing 14% and 5–10 person spaces growing 10% in the same quarter. This wasn't a one-off: similar "flight to quality" language and behaviour shows up consistently across the tracked quarters, with operators repeatedly prioritising newer, amenity-rich stock over older, cheaper inventory.
What this means in practice: if you're budgeting based on an "average" desk rate, you may be underestimating costs for both very small teams (1–4 people, where competition for quality space has pushed rates up) and very large teams (50-plus, where scarcity is now driving a genuine premium).
What This Means for Your Business
A year of consistent data tells a more useful story than any single quarter's headline number, and the practical implications are specific rather than general.Don't budget off the national average if you're in Sydney. The national figure has masked real, sustained increases in the Sydney CBD specifically — businesses budgeting off a national number for a Sydney CBD move have likely been underestimating costs for nearly two years running.
Watch fringe-CBD locations for relative value shifts, not just absolute price. North Sydney's softening at exactly the moment Sydney CBD was climbing made it a measurably better deal in early 2025 than the raw numbers from a single quarter would suggest.
Factor in segment-specific movement, not just city-wide averages. Whether you're a 3-person team or a 60-person enterprise, the "flight to quality" trend means your specific size bracket may be moving differently to the headline number for your city.
If you're currently comparing locations, our North Sydney and Parramatta pricing guides reflect the latest quarter's numbers specifically, rather than a trailing average that may not capture recent movement.

Compare Current Flexible Office Pricing
Whichever city or precinct you're weighing up, the smartest move is comparing real, current listings rather than relying on a trailing national average.Browse coworking space across Australia on OfficeFlexFinder, with verified, up-to-date pricing across every major city and region.
You can also explore:
- How much does coworking cost in Australia in 2026?
- Coworking space cost in North Sydney: 2026 price guide
- Coworking space cost in Parramatta: 2026 price guide
- Why enterprise teams are switching to flex space in 2026
- Global Co-working Space Insights: 2026 report
About OfficeFlexFinder: We help Australian businesses, freelancers, and remote workers find and compare flexible office space — from hot desks to private offices and serviced suites — across every major city and region in Australia.
Arthur Truong
Content Editor
Office space specialist helping businesses find their perfect workspace.
